https://www.mindtree.com/blog/revenue-management-pricing-how-one-informs-other
By Author: Brendan Kavaney
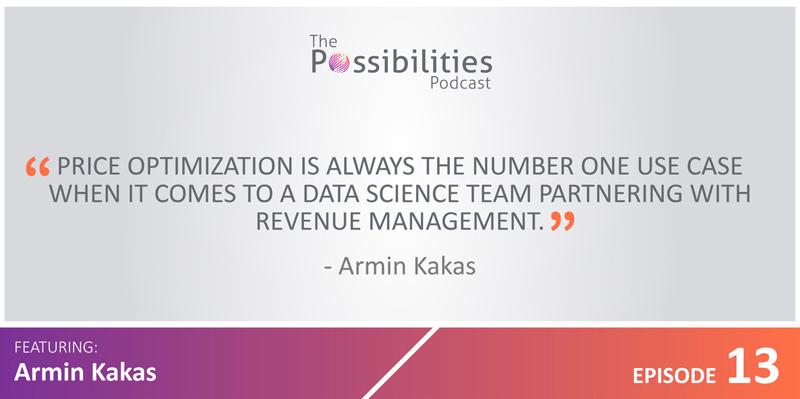
Featuring: Armin Kakas
https://www.mindtree.com/blog/revenue-management-pricing-how-one-informs-other
By Author: Brendan Kavaney
Featuring: Armin Kakas
American Tire Distributors (ATD) is one of the largest independent suppliers of tires to the replacement tire market. Through our rapid distribution network, with unrivaled sales specialists, an industry-leading digital platform, and robust data analytic capabilities, we’re connecting our customers to the road ahead.
We launched our Advanced Analytics Center of Excellence (AACoE) to disrupt and revolutionize the replacement tire industry through better usage of data and analytics. Our team of analytics experts are finding creative ways to leverage 80-years’ worth of data to its fullest extent. Through the application of artificial intelligence, big data and cloud computing, our AACoE is able to deliver award-winning platforms to drive business results.
Being one the largest independent supplier of tires to the replacement tire market, ATD isn’t typically a top employer that comes to mind (yet) to those studying computer science. Our AACoE is changing that, one algorithm at a time. Shreya is a senior computer science major at UNC Chapel Hill, has helped organize North Carolina’s largest hackathon, HackNC, and has recently completed a summer internship with our AACoE. We’re excited for Shreya to share her journey.
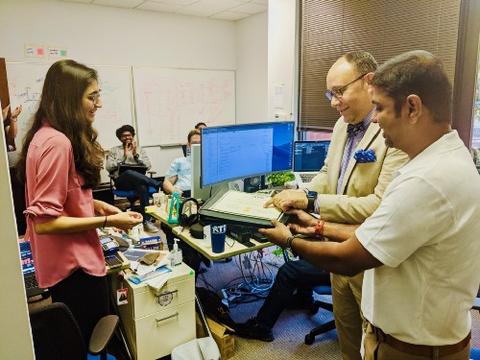
ATD’s Bill Williams, Chief Financial Officer and Ravishankar Sivasubramaniam, Senior Machine-Learning Solutions Architect present Shreya with a certificate on completing the ATD Advanced Analytics Center of Excellence internship program.
When I was searching for a summer internship, the last place I would have thought to intern with was a tire distribution company. But that’s exactly where I found myself this summer. When I was accepted into the internship program, I was excited, but nervous. The internship promised the ability to complete a project from development to deployment, but I thought this might be too good to be true. I was unsure if this promise would devolve into just basic data entry, which is every computer science intern’s worst nightmare.
When I arrived at ATD, I didn’t feel like an intern, I felt like a valued member of the analytics team. The first thing I noticed was that the AACoE operates like a cutting-edge startup in the valley, who is on the verge of the next great industry-revolutionizing platform. I was ecstatic to find out that the promise of being able to complete a project from development to deployment was very much real! I was handed a project that had the whole package and I couldn’t wait to get started. The project was to analyze the usage of internal tools across the company and build a dashboard that displayed various trends.
This dashboard was to be used across the business for various leaders. This wasn’t a sandbox project, but a project that impacted the way ATD did business. I was able to meet with the leaders who would be the end users of the dashboard I was responsible for deploying. This allowed me to truly understand the business, get a better idea of how the leaders were going to use the dashboard and allow me to implement an interactive user interface that would benefit ATD.
When developing the user interface, I learned how to make a lightweight web app with Python and Flask. I wrote SQL queries into their databases, experimented with data frames and Plot.ly’s syntax, in order to create charts and then brought the dashboard all together with some Jinja2 in the front end. I built a data pipeline that moved Google Cloud’s billing data to Cloud SQL. I added in charts that broke down what services the AACoE were paying for, contrasting with the charts of actual usage of internal tools built on those services.
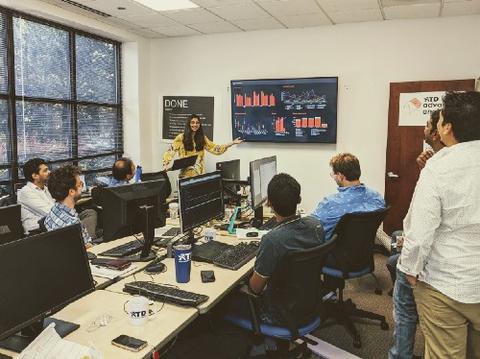
Shreya presenting the final project to members of ATD
After the dashboard was built, I had the opportunity to deploy and demo it to ATD’s Chief Financial Officer. I was very confident in my project because throughout my internship, I felt like I was contributing to something meaningful and was delivering a tool that would make an impact on the business. I was challenged, but every step of the project I learned something new. Seeing this project through from start to finish really gave me more confidence in my abilities. The members of the analytics team were actively invested in having me learn new skills and have something to show at the end of it. Being asked to build a simplified tutorial of my work really reinforced what I learned. To read my simplified tutorial, please visit my GitHub.
Looking back, I couldn’t be happier having been accepted to intern with ATD and their AACoE. I was able to learn how tires are manufactured when touring one of their vendor’s tire manufacturing plants and participated in other team building activities like going to the U.S. National Whitewater Rafting Center. The AACoE team is constantly learning from one another and frequent Lunch and Learns offered opportunities for everyone to gain insight from the expertise of others, including what I had cultivated during the internship when I had the opportunity to present. It was only natural that I learned so many technical and non-technical skills in an environment where people constantly communicate about what they’re working on and openly knowledge share. I am so grateful I had the opportunity to be a part of this team.
ATD’s Advanced Analytics team members at the Continental tire plant in Sumter, SC
We are grateful that Shreya interned with us. Thank you for helping us revolutionize the tire industry! If you are interested in learning more about internship and career opportunities with our Analytics Center of Excellence, please apply at https://atd.wd1.myworkdayjobs.com/Torqata_Data_and_Analytics.
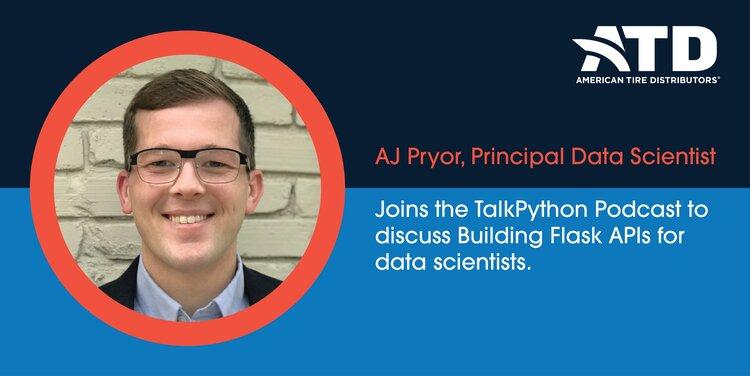
ATD’s very own AJ Pryor, Principal Data Scientist, within our Advanced Analytics Center of Excellence (AACoE) sat down with @mkennedy of the @TalkPython podcast to talk about structuring flask APIs for maintainable applications.
AJ is a data scientist, full stack developer, and Ph.D. physicist with expertise in high-performance computing and software engineering who focuses on driving business value through conception and strategic deployment of data-driven applications. He believes in all things testing, is always halfway through some sort of online course, and spends perhaps too much time slacking his coworkers about interesting new technologies or ideas.
Listen to the podcast here and hear how ATD, the nation’s premier tire distributor is disrupting the industry through advanced analytics.
Interested in learning more about how our AACoE builds data science applications?
At the upcoming Data Science North Carolina Conference 2019 — August 29–30, Join AJ as he shares a concrete example of this Flask pattern in action. He will also be discussing a type of optimization technique that is a key piece of several data science projects built by our AACoE including the Profit Optimizer tool, which uses the exact Flask pattern described in the podcast. Come hear firsthand how ATD is revolutionizing the tire and automotive industries with advanced analytics and enjoy a 40% discount with code AJP40.
You can also check out these other blogs outlining similar projects:
https://talkpython.fm/episodes/show/226/building-flask-apis-for-data-scientists
Featuring: AJ Pryor
Forecasting warehouse staffing needs with Long short-term memory (LSTM) recurrent neural networks (RNN)
Advanced Analytics Center of Excellence (AACoE) was invited to speak about an exciting AI-powered tool we built on Deep Learning that improves warehouse staffing and planning.
If you haven’t heard, Deep Learning is the next big thing in the field of Artificial Intelligence (AI). Originally conceived in the early 50’s, Deep Learning is a collection of learning algorithms that imitate human neural networks’ learning mechanism, which allows systems to learn specific tasks extremely well. When given enough training time and data, this powerful capability can perform these tasks better than humans. For example: notice how your Apple photo album (or Android google photos) automatically tags you, your family, your pets and even places you’ve been to in your photos. The underlying AI is running a sequence of what’s called convolutional neural networks (that combines simulated pattern-finding filters and neural networks) to identify consistently occurring objects/animals/humans from your pictures.
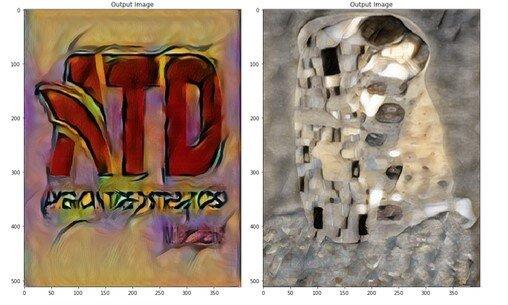
Here’s a previous blog where we painted the ATD Logo, Picasso Style by using convolutional neural networks to Transfer Painting Styles (PyTorch).
These convolutional neural networks see images so well that it’s beating professional doctors in accurately identifying lung cancer from CT scans. In similar ways, deep reinforcement learning helps Tesla cars drive themselves. It also guides SpaceX rockets by enabling them to land themselves. Recurrent neural networks also make translating different languages easy and convenient through simple Google translate. In many ways, Deep Learning is supercharging the tech industry to accomplish many previously thought impossible AI tasks.
And now Deep Learning is right here at ATD.
As the largest tech-enabled tire distributor in North America, ATD has more than 140 distribution centers in the U.S. and Canada, employing thousands of warehouse associates. With each distribution center located in different geographic locations and servicing a variety of customers, these DC’s require different staffing levels in order to operate efficiently. Each Distribution Excellence Manager (DEM) is responsible to ensure their DC is staffed with the appropriate number of associates in order to get product to our customers.
When looking at how to staff each DC, we asked:
· What are the variables of the staffing levels?
· Are they constant throughout the week?
· Are there different warehouse activities that happen at different times of the day?
· Is there room for efficiency improvement?
Our DEM’s are tasked with managing facility operations, including seeing our deliveries to our customers. For our DC’s to be efficient and safe, they need to be staffed with the right amount of associates. If we’re short staffed, we’re not able to get the product to the customer. But if we’re over staffed, there may be safety issues and increased operational costs. To help resolve this problem and enable our DEM’s with a more efficient way to staff their DC’s, we started to develop a DC staffing tool.
The main purpose of this tool would be:
1. To provide visibility of warehouse activity levels ahead of time so each DEM is able to staff and plan early and scientifically.
2. To recommend detailed resources (hours and headcount) required by time of day, day of the week and day-by-day into the future.
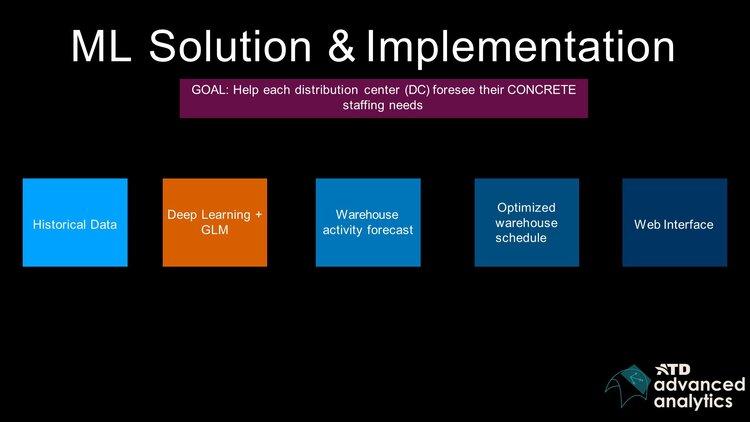
To do this, we developed the tool with five main components (shown above). We started analyzing data, mainly historical warehouse activity data, that we gathered from our handheld scanners. We also layered in sales data, vendor delivery data, outbound delivery data and product data. This gave us the core dataset needed for us to see how busy any given DC has been, what tasks occurred and how these tasks were being fulfilled for the past few years, down to the minute.
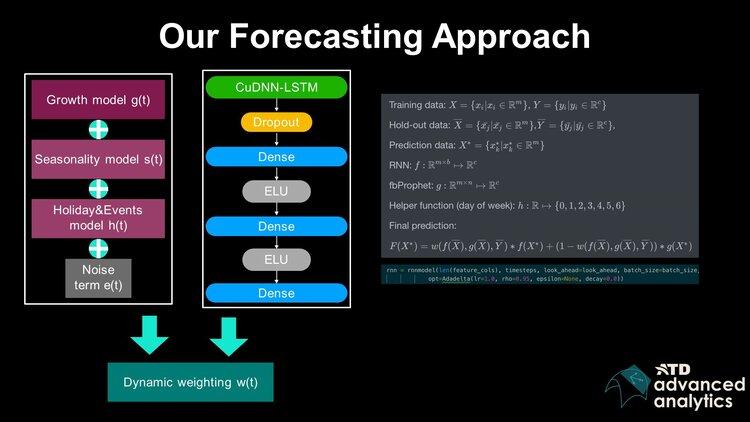
With this rich dataset, we were then able to run forecasting algorithms that could forecast daily activities by task type for each DC. This provided visibility for the DEM’s to see what their DC activity level would be for the next two weeks, day by day. BY having this forecast (accuracy ~85%-94%), a DEM can react to business needs and optimize their staffing needs ahead of time.
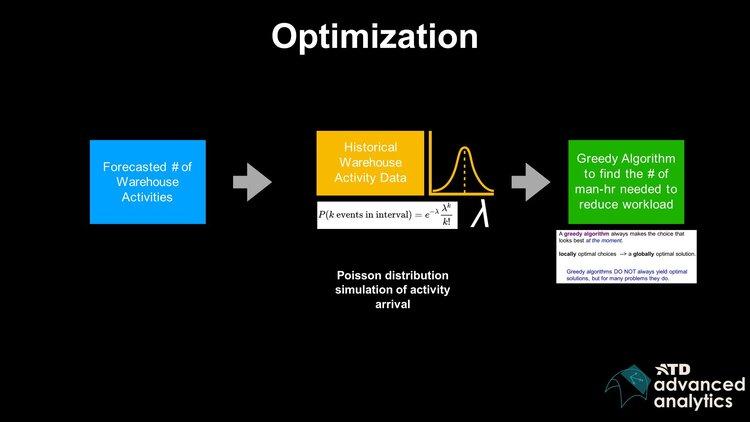
Now that we had a good forecast of warehouse activity levels, we needed to think about how this forecast influences the resources needed in the future. We achieved this goal by running an optimization algorithm on top of our daily warehouse activity forecast. The main idea was to study how activities arrived and occurred at each of the DC’s, minute by minute, by constructing a Poisson distribution using historical handheld data. We then used the Poisson distribution to simulate how those forecasted activities happen in the future and calculated what the required resources were to fulfill those tasks and activities.
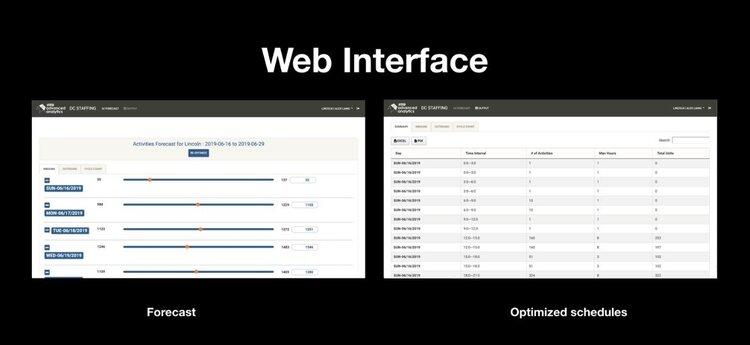
On the front end, we displayed these two results in a web portal, which is a simple way for the DEM’s to quickly see their DC activities.
We’ve now launched this tool to over 120 DC’s across North America, enabling our DEM’s to staff and plan efficiently for their warehouse operations. We’ve built thousands of Deep Learning models that can generate forecasts and many simulations have been run to generate resource recommendations.
Being able to present this work at the Applied AI Summit has been a rewarding and inspiring experience. ATD is pushing the AI revolution by applying state-of-the-art approaches into real world applications and solving concrete business problems in a traditional industry (that isn’t tech or robotics). This is another step in ATD’s digital transformation and we look forward to sharing more exciting projects and tools with you in the future!
If you’re an avid reader of this blog (which we hope you are!), then you probably know that ATD is on a mission to become a reputable analytics and technology company. As part of that mission, we want develop a strong talent pipeline, develop a reputation as a great place to learn and grow, and act as an accelerant to the data science community in the Southeast.
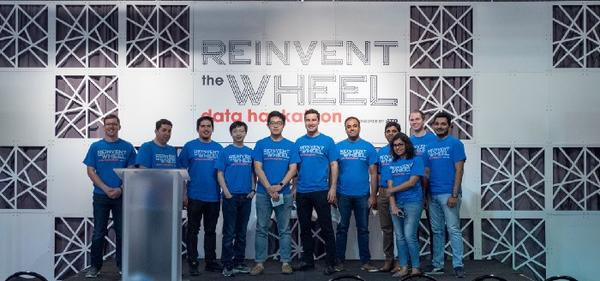
What better way to achieve these goals than organizing a Hackathon that brings together students, professionals, ATD associates and executives from the Charlotte area? This was our thought in Q4 of 2018. But where to begin?
You may have similar questions, so please find below our “hacks” to organizing an awesome hackathon.
Hack #1: Start early and plan ahead
Make sure your event doesn’t overlap with another hackathon, or else you’ll be competing for venues and attendees. Once you have a few dates that might work (start with a Friday evening to accommodate work schedules and make sure you don’t overlap with exam periods or holidays), you’ll want to secure a venue.
We hosted our Hackathon at CenterStage in the NoDa-area of Charlotte. The industrial warehouse charm was up our alley, but brought a host of challenges like inadequate WiFi, electricity, seating, etc. You may also consider venues at hotels, co-working spaces or universities. We finalized our venue about four months before the event — and we were quite late.
Hack #2: Marketing, marketing, marketing
Once you have a date and a venue, you can start recruiting teams. We recommend setting up a website with a registration capability and creating posters that you can share electronically. We realized quickly that word-of-mouth marketing worked best for us — we had each ATD CoE team member reach out to their schools and visit a few local universities and we received close to 500 individual sign-ups.
Because our Hackathon was data-science focused, we did some pre-screening of candidates before selecting participants to fully register their team. Registration closed one month before the event, which is when we reached out to each team to confirm participants, dietary restrictions, etc. To encourage participation, we recommend a high-touch approach. This means effectively communicating with your participants about travel accommodations, what to expect at the event, and more. This will help ensure that all teams attended and are prepared for the event.
Hack #3: Find an awesome (yet solvable) problem
You’ll want to pick a topic that matters to you. It’s really cool to see students dig into something that’s relevant and can be used in your day-to-day. It also makes for a more realistic experience for the participants. We asked students to build a predictive model using ATD sales data, vehicle registration data and a whole host of external data sets. When you define the problem, you’ll want to make sure it can be solved in 24-hours and you’re able to judge it. We brainstormed topics as a team three months before the event and one of our organizers then spent about two months assembling the data sets, testing the problem and building a baseline model.
In order to make judging easier, we recommend provide instant feedback to increase the competitiveness. We custom-built a scoring app for the submitted models (stay tuned for a blog post on how the scoring app was created). It was fun to see the live leaderboard during the event and how all teams kept going for the entire 24-hours. We gave teams a few pointers regarding the nature of the problem before the event so they could prepare. You can view the documents here: “know before you go” and “problem statement”.
Hack #4: Spend money on the little things that matter
You’ll want to make sure participants have a good time. It was important to us that we had food available at all times (who likes to code hungry?), and some fun surprises like a popsicle cart, chair massages in the morning (we had a therapist offer 15-minute slots — everyone LOVED this after staying up all night) and fun games throughout the event with little prizes (who knew that Tire Bowling would be such a big hit).We also recommend having a videographer — the footage makes a great promotional tool!
Hack #5: Broaden your audience
Hackathons aren’t just for hackers. ATD is transforming across the board and we wanted to involve all our associates in this event. Many of us are excited about our transformation and want to be a part of it. With this in mind, we concluded our Hackathon with an award ceremony that featured presentations of the top five teams, a chance to network with sponsors and other analytics companies, confetti cannons and some great prizes. While most of our 200 guests probably didn’t get the intricacies of the solutions, it made for a really fun Saturday evening and was an opportunity for ATD to broaden the reach of this event. And for everyone that was unable to attend, we posted the event on Twitter, Instagram, Facebook and LinkedIn.
We hope this helps you in organizing your own Hackathon. Ours was a great success and we can’t wait to host an even better one in 2020. Please check out this recap video of the event, the photo gallery on Facebook as well as what the leading tire publications wrote about it.