We are excited to announce the latest updates to our Torqata tools in our first major release for 2021! We have made improvements across the board, with the most noticeable ones in Category Compass and Market Price Explorer.
We have focused on simplifying the navigation, improving recommendation logic, and giving you more transparency into comparable data points.
Key benefits and updates
Review your inventory performance across all your stores at a glance
Get recommendations that optimize for inventory profitability
Understand the why behind our recommendations by seeing sales and demand data side-by-side
More easily compare your prices with the local and national averages
These updates can help you make better-informed, data-driven decisions for your business. We understand that your time is valuable and that the daily decisions that you make on what to stock and how to price is very important to how you operate your business. This is why our focus was on improving the following areas:
Category Compass -To improve the overall experience, we updated the way that we calculate our recommendations and how we present the data to you to make it more actionable and insightful. These updates include new “Current Inventory” and “Recommendations” tabs, side by side comparison views, and more data points for you to better analyze your store performance. Learn more about how Category Compass works
Market Price Explorer -New columns make it easier for you to compare your price with the local and national averages. Learn more about Market Price Explorer Thank you for being a trusted customer. At Torqata, we believe in continuous improvement and promise to keep improving on our products so that they are customer-centric! We are excited about the additional updates that will roll out throughout 2021.
Our analytics team at ATD is comprised of a wide variety of data scientists, data engineers, and software developers. Although we come from different backgrounds, we all touch the data science modeling component at some point or another in our daily work. To make sure we avoid situations where model building turns into a multi-month-long complicated extravaganza that ends in an unscalable model, we try our best to stick to a simple set of what we call our “10++ Commandments” (C++, JavaScript pun intended). These were learned from hard experience, so you don’t have to!
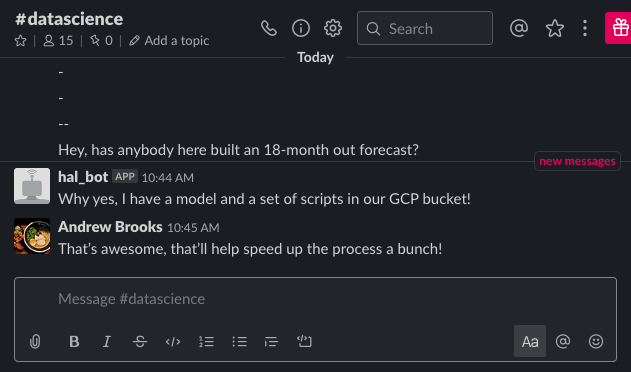
ONE — Thou shalt always check if teammates have built existing tools for what you want to do.
“I remember someone mentioning a similar product clustering project; they may have some code in the monorepo that can already do what I’m about to do.”
It’s easy to get the urge to dive right in and start building a tool when you get a new use-case from the business. Once you’ve mapped out a potential solution to the business problem, it’s helpful to take a step back and look at each component of your proposed solution. When viewing each component, ask yourself:
Has anybody on the team worked on a similar problem before?
Does a component of the potential solution (i.e. clustering) lend itself to something that has already been done?
For example, say you’re trying to build an 18-month forward-looking demand forecast at the product level. With tens of thousands of products to forecast for, the best approach to your solution is clustering products by how they sell and building a cluster-specific model. At this stage, you could start experimenting with dynamic-time warping, or bust out numerous SKLearn clustering packages. But when you ask yourself the questions outlined above, you instead open Slack, Internet relay chat (IRC), or ICQ and ask your teammates if they have any existing tools or analysis from previous projects with similar components. A colleague may have already been through the processing of finding the best way to cluster products together based on how well they sell for another project, which can ultimately save you a lot of time.
This can help create a standardized way of clustering products, or maybe you find that there’s an existing table with products and their assigned clusters. On the other hand, if teammates haven’t produced similar outcomes to what you’re looking for, you can find out what experiments have already been done previously. This can be used to help cut your work time down by a measurable amount.
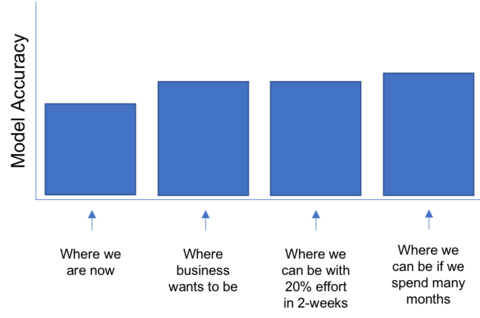
TWO — Thou shalt always know what is good enough for the business customer — what’s “80%” in the 80/20 rule?
“Our current third-party forecast is at 60% MAPE (mean absolute percentage error) at the warehouse-item level; the business wants us to be at least 1% more accurate at the SKU-level, but not spend a lot of time trying to squeeze out more.”
The end goal of most projects is one of the following:
Increase profitability
Decrease expenses
Decrease the time needed for a specific process
This is where the 80/20 rule comes into effect. Also known as the Pareto principle, this states that, for many events, roughly 80% of the effects come from 20% of the causes. This is important, as you might be able to derive 80% of the value of a project with only 20% effort.
For example, trying the latest-and-greatest alpha forecasting package may purport to squeeze that extra 1% inaccuracy over your third party forecast, which may derive 80% of your value with only 20% of the effort, but the next 20% of value might take 80% of your time. If the business needs a quick turnaround on a forecast model that’s as accurate as a previous version, it’s probably best sticking to the tried-and-true methods that will bring out the 80% value with the 20% effort. This question should be asked and answered up-front: “What is good enough?”
THREE — Thou shalt always start with simple models that can serve as a base comparison for other models.
“If I use lag1 in a linear regression, I get 55% MAPE, which is almost what I need.”
Every data scientist dreams of reading a paper that outlines a sophisticated new model or a complex hundred-stage pipeline and then immediately searching for the GitHub repository where it’s being implemented. Or, you may even try to build it yourself. Starting a project with a sophisticated model or complex process makes both debugging and figuring out which components bring the most benefits to the final accuracy numbers that much harder.
When you start simple, this doesn’t mean you need to run multiple linear regressions with one predictor every time you’re building a demand forecast. For example, when running your Facebook Prophet model, you should use the default values before any further tuning or adding any exogenous regressors. It’s entirely possible that the base model fits the needs of the business customer — but what if it doesn’t? You end up with an easily obtained base model for which you can compare your more sophisticated modelling exercises against. This is extremely helpful for determining whether the tweaks you’ve done to your sophisticated pipeline are conferring the benefit you think they are, when you check it against the base.
FOUR — Thou shalt always start with a simple feature set and add incrementally.
“I’ll just start with tables that are easily available so I can get a feel for what a small feature set can do. Maybe I don’t need a whole new ETL process for a feature that isn’t necessary to hit the goal of the business.”
There’s nothing morally wrong with putting all your tables into a design matrix and seeing what the model will find important. There’s always the option to just funnel them through feature generation tools like Featuretools or tsfresh. These tools can do the feature engineering work for you, but sometimes can come at a cost. Here are four things to consider:
You’ll deal with the curse of dimensionality when adding a large set of features. If a set of simple well-engineered features are working well, this might not be something you need to deal with from the beginning.
Computation time increases with a larger feature set. Utilizing every table to achieve the 80% point might not be necessary, as this could be wasting valuable time.
We’ll bet that most of the data you want isn’t available as simple SQL queries from tables you already have access to. Including a plethora of features at the beginning may cause your data engineers to run large ETL processes that ultimately aren’t needed if you find the features in your already-existing sales table are good enough for the business.
Explaining and generalizing from complex models can be difficult.
Testing a large set of features isn’t wrong — at times it’s necessary to find those diamonds in the rough that might improve your model. We’re pointing out that if you’re on a time crunch, it’s not always necessary to have all those features to reach 80% (which you should know from commandment two). Adding them in can be a large effort, especially if your data is all in disparate places and the set is large.
FIVE — Thou shalt always start by utilizing open-source packages before “rolling your own.”
“I would like to design my own Bayesian forecasting package, but Facebook already has a package that does 90% of what I need to do.”
This could be met with many exclamations of “that’s obvious,” but many companies reinvent existing open source software for internal use. For good reasons. Companies with a small data science team are 95% more likely to leverage an existing open source package. These teams may only be doing standard projects like building a churn model, demand forecast or a predict prospective clients model. For these and similar projects, there’s most likely an open source package that can either be used outright or used as inspiration.
For example, we’ll look at demand forecasting. Companies that are using statistical forecast (say, a mixed model or ARIMA-based approach) without exogenous regressors give more opportunity to their data science team. Teams could start including the weather and availability of raw materials, which could lead to a 50% increase in MAPE. From here, teams could build an XGBoost model that predicts one step ahead. Besides the fact that for many companies, a multiple-time period horizon is necessary for a forecast and building separate models for each time step out isn’t feasible. With numerous tried-and-true forecasting packages available (that also allow the use of exogenous regressors), each of these packages provide multi-horizon forecast functionality: fbprophet; Forecast; Fable; Gluon; statsmodels; and scitkit-learn.
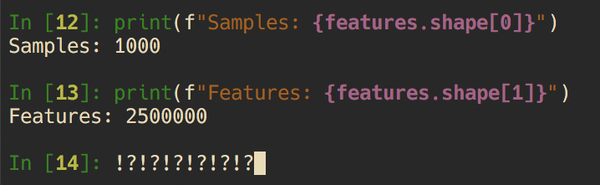
SIX — Thou shalt always time your modelling exercises and extrapolate out to a full dataset: Big-O is not just a Wikipedia article.
“It takes 10 minutes to train my model on 6,000 samples, but I have 2 million in the full dataset. How is this going to scale when it’s time?”
Big-O related questions are standard for data science interviews — and there’s a reason. Data scientists will often subset their data when building models so they’re not having to run a multi-hour model, followed by some tweaking and repeating the process. A representative sample of the underlying dataset, in most cases, can provide a way to rapidly develop a pipeline. Sometimes it’s easy to get stuck into forgetting how a pipeline will scale when you’re only dealing with a subset of data.
If a full pipeline runs in 10-minutes on 6,000 training samples, how‘s it going to run on the full dataset of 2-million? Questions like this need to be considered early in the process. It’s also an issue that can easily be caught — determine the complexity of each step and extrapolate out on the full data set. If this ultimately is too complex, run your pipeline on the full dataset and see your compute cost sky rocket.
SEVEN — Thou shalt always consult with colleagues when stuck.
“I may be embarrassed about being stuck on how I’m going to scale my forecast to all DC-SKUs, but our solutions architect is one heck of a guy who can spot a problem before it happens — maybe I should ask him.”
It’s a common human desire to be self-sufficient. In most cases, this is great — it encourages learning, responsibility, etc. But it’s also an important skill to know when and how to ask for help.
Embarrassment about feeling like the question is too basic, or fear of being “outed” as an imposter, is common in the tech world (or any industry). The reality is two-fold. One, somebody else might have the same question. Two, you don’t want to end up weeks down the line when something doesn’t work, knowing that you had thought about it but got stuck and decided to trudge ahead anyway.
There’s always a point at which Google-fu no longer cuts it — particularly for larger theoretical questions or questions regarding the specific pipeline you’re working with. A second set of eyes can often spot the cause of a problem immediately that would’ve taken hours to find and a different perspective on the problem can lead to a better solution. You may also learn that someone else has already gone down this path and knows a different approach.
There’s also respect for your colleagues time, as you don’t want to ask them questions every five seconds when the answers could have been found on Stack Exchange. You also don’t want to increase their Slack notification count during crunch time, asking how to sort an array in NumPy. There’s a balance between “asking too soon” and “waiting too long.” With more experience, these scenarios are much easier to balance. This can be learned without sampling the space by simply asking questions. If your answer can quickly come from a Google search, but you ask anyway, then you’re probably asking too soon. If you’ve been to Stack Exchange, Google, Quora, the API docs, then maybe it’s time to ask for help.
EIGHT — Thou shalt never agree to deadlines without consulting the technical leads.
“Jacob is asking me to get this done for tomorrow to present to a Business Unit “BU”. I think I can do it. But I should probably run by the tech lead of my team before agreeing to it.”
This should be standard operating procedure, but lines of communication can become complex inside any organization. Maybe a BU that you’ve done work with needs you to run a quick ad-hoc analysis. This one should be simple — if you’re an individual contributor, don’t agree to deadlines until speaking with your tech lead, as they may have more insight into the bigger picture (technical or project-wise). Likewise, if you’re more on the management side, deadlines shouldn’t be set without a prior discussion with your team leads and a true understanding of the work involved and how that will affect other projects.
NINE — Thou shalt optimize to a reasonable degree before resorting to big compute.
“It takes a 1024GB RAM VM for my script to run right now. Maybe I should think about using NumPy arrays, down casting my variables, using Dask and removing unused columns instead of increasing the VM size.”
So, the pipeline you’ve developed in Jupyter notebook is requiring you to spin up a VM with 400GB of RAM? Sure, you’re still in the development phase, but:
a) this is most likely costing a lot of money to run a VM that large and;
b) at some point somebody is going to make changes so the production version runs reasonably well without a gargantuan amount of cores or RAM — at least do the proper ROI analyses on it.
As a data scientist, there’s a lot that can be done to avoid this early on. You’d be amazed at how much memory is saved by down casting a Pandas data frame to proper types. That is, maybe you don’t need an int64 type for a specific column; int32 might suffice. Maybe you should consider converting your categorical variables from strings into the Pandas category type. Maybe you don’t need a data frame at all; maybe you could store everything in NumPy arrays. If you’re sure the datasets are large enough that they should be run out-of-core, maybe you should consult with your solutions architects on potential package-based solutions — that is Dask, PySpark, Modin, etc. (or your R equivalents). Some modicum amount of optimization right at the start can help keep things in check down the road.
Like everything in life, there needs to be a balance between necessary optimization and over-optimization. This all comes back to the “80/20 rule,” where you can gain 80% of the value of something using 20% of the effort. You need to think about the bigger picture and make sure that the pipeline you’re tasked with building can meet the demands of what you reasonably expect to happen when it goes into production. And if you’re not sure what this is, consult your solutions architect!
TEN — Thou shalt know why you’re doing what you’re doing.
“There’s a really cool method I could apply to this data; not really sure what the purpose of it is, but it’s a lot of fun to play around with it.”
Unlike research-oriented or academic pursuits, applied data science should be results-oriented. For example, why are you running a new dimensionality reduction technique on the feature set? Is it because you’re suffering from the curse of dimensionality and you’re trying to improve your model accuracy because so far it hasn’t met BU expectations? Or is it because you read about the new method on Hacker News or /r/machinelearning and just want to experiment? What’s the value of what you’re doing? Will it reduce overall computation time, which in turn will save compute costs to an appreciable degree? Or is it a case of playing with the new shiny toy when the old one would work just as well? These aren’t questions that are meant to irritate — in the larger picture, a data scientist is part of a team whose goal should be bringing value to a company. In most cases, if you’re doing something and you don’t know why it will help with the bigger ROI, you’re doing it wrong.
Just like every point mentioned above, there’s a balance. Learning is a valid purpose in and of itself. A good workplace and a good manager will want to foster their team to keep learning and keep growing in every aspect — technical, personal, managerial. The majority of data scientists probably don’t want to work in a workplace that doesn’t encourage you to experiment or work with packages that you’re not entirely sure are going to contribute to the BU value, but this is a discussion that should be had with your tech lead or project manager. Ideally, they should be building in time to allow for this learning (and not just after works hours). But you won’t know unless you have the discussion.
Conclusion
By following these commandments, even to a cursory degree, they can help you avoid model building processes that seem to never end. It allows your data scientists to be flexible in what they do, allowing that itch of curiosity to be scratched, but by the same token keeps the larger business context in view. We learned through experience that there needs to be some standardized set of ways a data science project should flow and we hope that you’re able to learn from our experience to keep your analytics team running in tip-top condition.
Our Analytics Team needs to adapt quickly when it comes to changes on a project, which is why they’ve been relying on the Google Cloud Platform (GCP) services. The GCP enables our Analytics Team to implement many of its projects to the business seamlessly and is a key part of their project plans. Google recently hosted a Cloud OnBoard session in Charlotte and some of our analytics and IT associates were able to participate. This full-day learning event provided users with an overview of the GCP and best practices so they can get the most out of the services offered.
For our analytics and IT teams, the GCP is a valuable resource. The platform gives developers the ability to switch to the service that is the best viable option, based on the project requirements. This saves our team from having to build a service from scratch and use valuable time. One of the key advantages of using a cloud platform is not having to deal with the required maintenance of a physical infrastructure for a specific service.
One of the services highlighted in the GCP training was BigQuery. This is Google’s fully managed and serverless data warehouse service, which is a building block for many of our analytics projects.
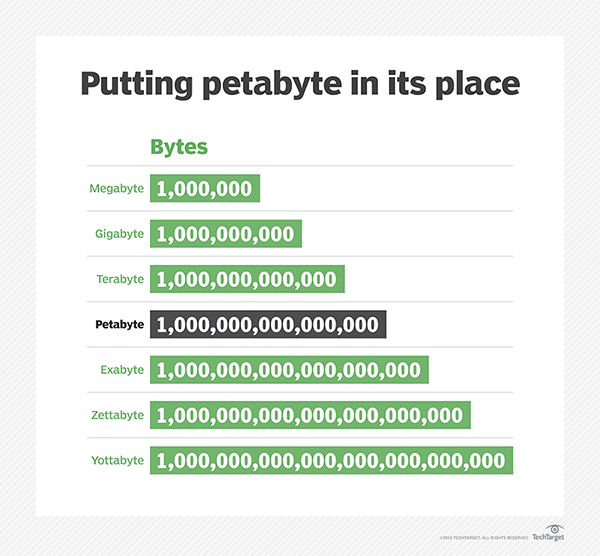
BigQuery offers several advantages over a traditional data warehouse. First, it doesn’t require the maintenance and administration of any physical hardware. Second, the storage and computation are decoupled from each other. This setup provides users the ability to scale variables independently and on demand. BigQuery has the ability to scan data very quickly, up to petabytes (1M gigabytes) per second. Being able to scan data at this speed would be very expensive with a traditional data warehouse or may not even be possible, depending on the IT infrastructure of the business. This service provides greater flexibility and cost control when scanning through data. The on-demand functionality allows our team to scan data when it’s needed, rather than keeping an expensive cluster running constantly.
Another great advantage of BigQuery is the different way a user can interact with the service, such as using SQL through the BigQuery web UI or bq command-line tool. These options give data analysts that are more familiar with traditional SQL, and prefer to use python or other programming languages, to integrate BigQuery data processing function in their projects.
During the training session, a key area of discussion was getting a new user comfortable with the GCP and understanding the services it can provide. For new users, there are potential risks of running into unexpected charges because of a misunderstanding in the pricing rules that Google Cloud follows. For example, on BigQuery, the instructor emphasized the importance of understanding the pricing structure on the pricing page and to leverage the BigQuery best practice guide in order to help drive down the cost.
Often a simple action that feels harmless can be very expensive if a user is not aware of the costs associated with an action. For example, selecting multiple, or even all of the columns from a table, is a common practice in a traditional data warehouse environment. However, this action is to be avoided in BigQuery and only the columns that you need should be selected when performing a query. The reasoning is that the cost of the operation depends on the scanned data size. You can also preview the query before running them, which allows you to estimate the cost.
If you’re just starting to explore the cloud, we recommend attending a Cloud OnBoard session. You can search for upcoming sessions here. If you’re unable to attend an in-person training or want to explore on your own, QWIKLABS can be extremely helpful. This platform offers a series of tutorials, each exploring a different GCP service that is associated with a temporary project. This allows users to learn how to use many of the services the platform offers while keeping costs to a minimum.
We look forward to sharing more information in future blogs on how our IT and Analytics Team leverage the Google Cloud Platform and the various services it has to offer, to help keep our customers connected to the road ahead.
In November, 2018 we introduced the world to our Data & Analytics Addicts at American Tire Distributors. Since that time our Analytics team has gone on to produce an award-winning tool, develop a recruiting strategy for attracting and retaining top analytics talent and fully embraced ATD’s culture of knowledge by providing associates the opportunities to develop their analytics knowledge.
They bring associates together for monthly “donuts & data” sessions and share project overviews through our ATD blog.
But, is that enough? Could they do more?
These are some of the questions that the Analytics team asked themselves. This is how ATD’s Data Science Accelerator (DSA) program was born. The program needed to add value to the business and our associates. In the end, we developed a program that provides associates the opportunity to explore the world of data analytics, work 1:1 with analytics team mentors and the opportunity to be put on a “fast track” interview process for a junior data scientist role, if available.
For 6-months, through an enriched learning environment, associates will learn the basics of Python programming, statistics and machine-learning. With this new-found knowledge and the support of their mentors, each associate will go through a capstone project. The program adds value to the business by providing graduates of the program the skills needed to tackle business problems with data-driven solutions.
Let’s look at the 4-key areas of our DSA program: Content of the Program, Tech Infrastructure, Recruiting Participants and Program Cost. We recommend considering these areas when standing up your own DSA program.
Content of the Program
The 6-month DSA Program is broken into two segments: online learning and a capstone project. During the first 4 months, participants complete various online learning courses. These courses cover the fundamentals of data science, including the basics of data ETL using SQL, Python programming, Data manipulation, machine-learning, statistics and a few other advanced topics.
Our analytics team put a lot of thought into what the curriculum should be in order to maximize the knowledge output for the participants. The online learning modules take 10 to 15 hours per week to complete, on top of their normal work load. It was critical to have the correct courses and the order of how the participants would progress through the modules.
Another critical area was providing the proper support throughout the program. Meet David, Salman and Sid, the DSA mentors from our analytics team. They’ll provide the support and guidance to participants through weekly mentor meetings and a dedicated slack channel. Each mentor will work closely with a pair of participating associates.
Analytics Team Mentors Left to Right: David, Salman and Sid
After completion of the first 4 months, participants will work with their assigned mentors and complete a 2-month long capstone project. The capstone project will focus on a business problem from their respective business unit and will require the development of an actionable data-driven solution. To showcase their talents and capstone project, we provide participants the opportunity during a demo-day to present their data-driven solution.
Tech Infrastructure
Given the technical requirements of the program, our associates needed the proper computing environment. Immediate challenges we identified:
1. Most associates use laptops that don’t have native support for Python.
2. The laptops range in a variety of models, with different versions of Windows, hardware components and overall computing power.
We asked ourselves: “How do we make a consistent and standardized computing environment for each associate based on these challenges?”
The answer is in the Cloud. The Google Cloud to be exact.
With assistance from our internal Google Cloud support team and IT, we set up a separate Google Cloud Platform (GCP) dedicated to the program. The GCP environment enabled us to host virtual machines (VMs) for each participant in the DSA program.
We recommend using a similar setup as this solution has many advantages:
1. All VMs run Linux Ubuntu operating system, arguably the most Python/Opensource friendly OS out there.
2. Each participant has their own VM, allowing an easy to maintain individual dependency, while keeping hardware level settings consistent
3. VMs are easy to reconfigure, so we’re able to add/reduce compute power, memory and access to different databases across the organization.
The only requirement for associates would be to install the Linux Subsystems on their laptops. They’ll use the Linux Subsystem terminal to access the remote GCP VMs. This allows them to leverage the remote GCP VMs throughout the DSA program for their coursework and capstone projects. Problem solved!
Recruiting Associates
For the inaugural DSA program, we decided to cap participation to 6 associates. We wanted to ensure our mentors could provide each associate the support and guidance needed to succeed. It was important to make the program diverse and fill the 6 spots with associates who represented different business functions, backgrounds and industry experience. After creating collateral that helped inform associates of the DSA program (flyers, FAQs, etc.) and setting up a Google Sheet sign-up website, we introduced the program through ATDs internal communication channels, and our leaders, encouraging associates to apply.
What happened next blew us away! After 2 weeks, more than 120 associates from across the country submitted their application. Applicants represented various business functions and levels throughout ATD. The submitted applications were very impressive and ranged from a delivery driver in Oklahoma to a senior director in finance.
Questions from the DSA program application
As part of the application, each associate was asked to rate their level of expertise with Excel, SQL, Virtual Basic and if they’ve had any exposure to Python or R programming.
The most important section of the application covered “why” the associate wanted to join the program and what they hoped to get from it. This provided the insight into what motivated the them.
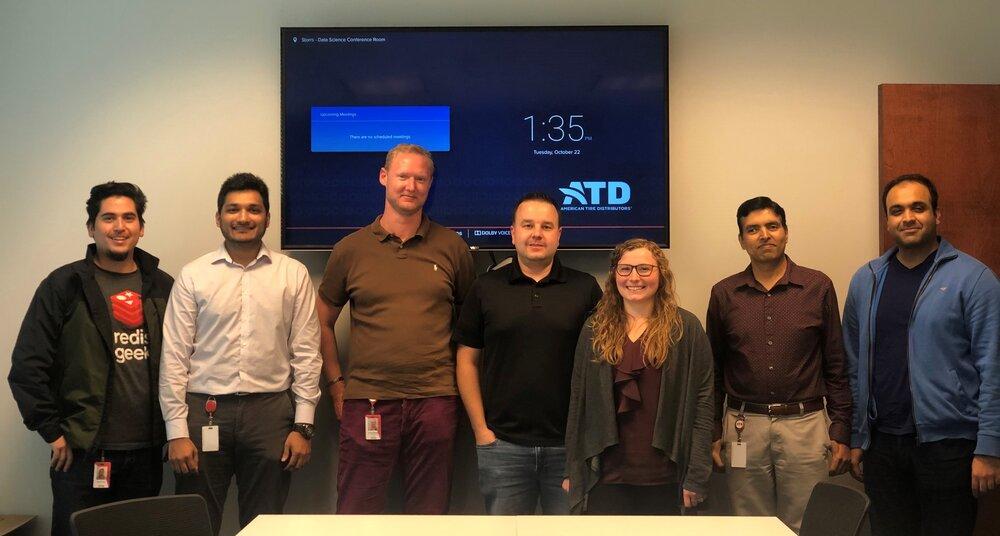
Through much deliberation and discussions with business leaders, we selected our very first DSA program participants. Congratulations to Colleen, Daniel, Doug, Mike, Sridhar and Steven on their acceptance into the inaugural DSA program! These associates represent our sales, revenue management, supply chain, finance, IT and eCommerce teams.
ATD Associates Left to Right: David, Doug, Mike, Sid, Sridhar, Colleen and Alex
Program Cost
When we set out to create this program, one thing we were unsure on was if this was going to be cost efficient. After doing a lot of research and coming up with solutions to the challenges we faced, we were able to design a program that costs less per associate than many analytics online certificate programs!
The cost for the entire DSA program includes the online learning licenses, setting up the GCP VMs and we even calculated the cost associated with support from our ATD business partners.
We’re thrilled to give associates the opportunity to learn, grow their knowledge and be able to provide actionable data-driven solutions to their business functions.
We’re excited to launch this program and further embrace ATD’s culture of knowledge. We look forward to sharing future updates on how the program is progressing.